Hemodynamics
A Practical Application for Today’s Nurses
There are many references from earliest recorded history, that demonstrate that even early on, humans recognized that there were certain essentials to life itself, such as breathing, blood, and pulse.
• "And the Lord God formed man of the dust of the ground, and breathed into his nostrils the breath of life; and man became a living soul." Genesis 2:8 (the Bible)
• Hippocrates stated that the heart "supplied the human body with life." (5th century)
• Pneuma (a spirit taken in with each breath) and blood meet in the heart for delivery to all parts of the body (ancient Greek and Roman history)
Even in the early 20th century, there were few assessment tools available to assess the status of a patient. Blood pressure was a measurement taken by physicians as it was "too advanced" for nurses. Rapid progression of new and innovative assessment tools were born in the 20th century along with cures for fatal diseases with the introduction of antibiotics.
• TPR were the only measurements monitored and recorded as part of evaluation for severity of illness 100 years ago.
• BP became a routine measurement in the late 1920's.
• Antibiotics improved patient outcomes in the 1940's in diseases that were usually fatal (i.e. pneumonia, TB, bacterial endocarditis).
The Korean and Vietnam Wars taught us different ways of managing critical illness and trauma. The use of invasive monitors such as pulmonary artery catheters taught us the affects of interventions, such as fluids, and vasoactive medications on hemodynamics.
• Evolution of Intensive Care as a specialty in the 1960's.
• Hemodynamic monitoring techniques vastly improved diagnosis and evaluation of critically ill patients (1960's to 1970's)
• Technology continues to evolve and improve rapidly
Because much was learned through the used of invasive monitoring devices, assessment of the patient has improved to the point that care can be provided without them. Through the understanding of the patient's condition, we can provide therapy without putting the patient at risk using the devices.
What goes around comes around…. Through the use and study of invasive monitoring devices, we know more now than we did in the 1960's and 1970's.
• We now opt for less invasive assessment techniques
• Patient outcomes do not improve with the use of invasive monitoring devices
• Invasive monitoring devices increase the risk for injury and infection
Hemodynamics concepts in the past have been identified with care of the critical care patient in mind. In today's world, these concepts should be applied to any patient in the acute care setting. We no longer have "well" patients in the hospital. It is important for nurses in all areas of care to be able to critically think and assess patients, in order to provide appropriate care.
• Blood flow, blood oxygen content, and oxygen consumption are fundamental to life and are critical parameters in the evaluation of critically ill and injured patients.
• This concept is applicable to all patients in the acute care hospital setting. Think perfusion!
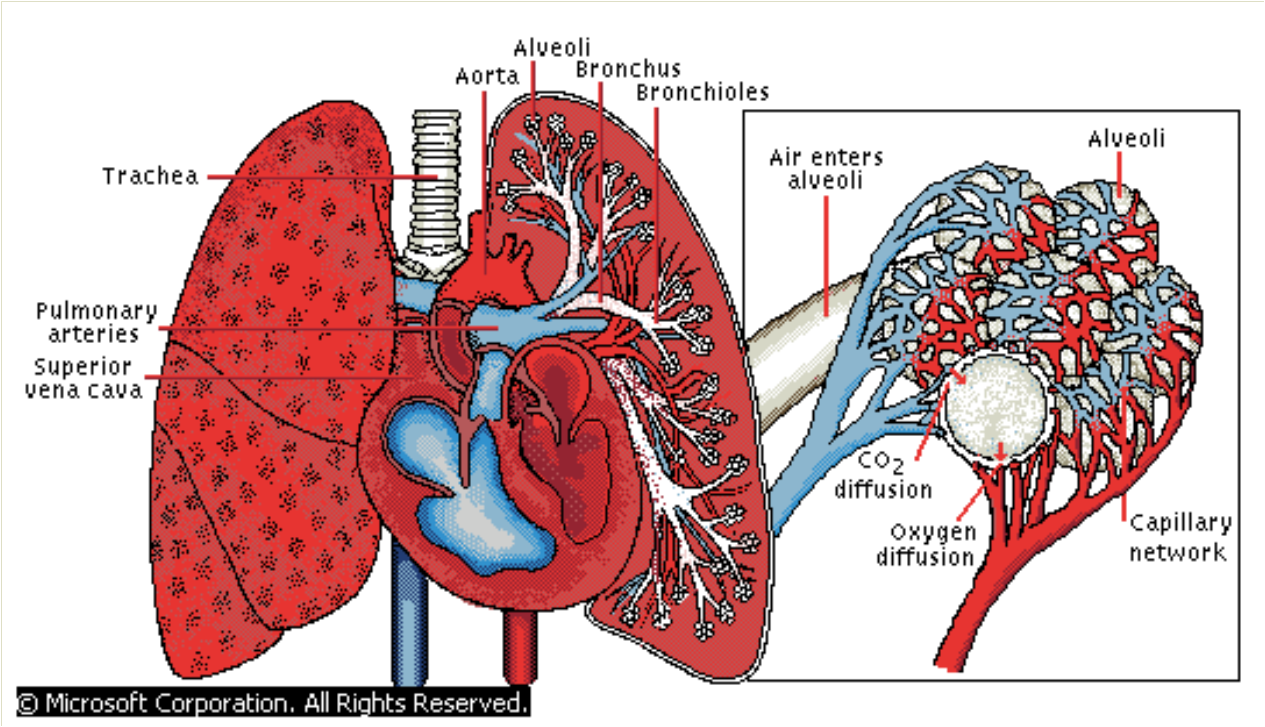
This is a brief overview of pulmonary anatomy, physiology, and function.
• Respiration: movement of respiratory gas molecules across cell membranes.
• Ventilation: exchange of air between the lungs and atmosphere.
• Ventilation: movement of gases in and out of lungs
• Distribution of gases from the upper airways and tracheobronchial tree to the alveoli
• Diffusion: the passive two-way transfer of respiratory gases from the alveoli, plasma, RBCs, and body cells
• Perfusion/transport: movement of oxygenated blood through pulmonary capillaries & veins; delivery to the cells
This is a brief overview of cardiac anatomy, physiology, and function.
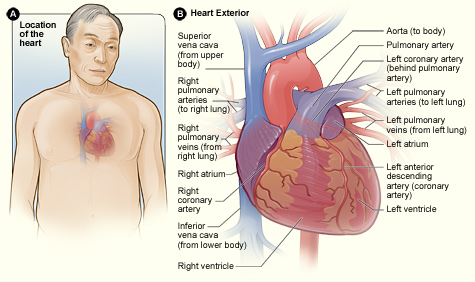
• Continuous, closed, fluid-filled, elastic circuit equipped with a pump
• Heart: pump which forces blood through the vascular system
• Arteries: conduits that deliver cardiac output (oxygenated blood) through the body, and to the organs, regulated by metabolic need
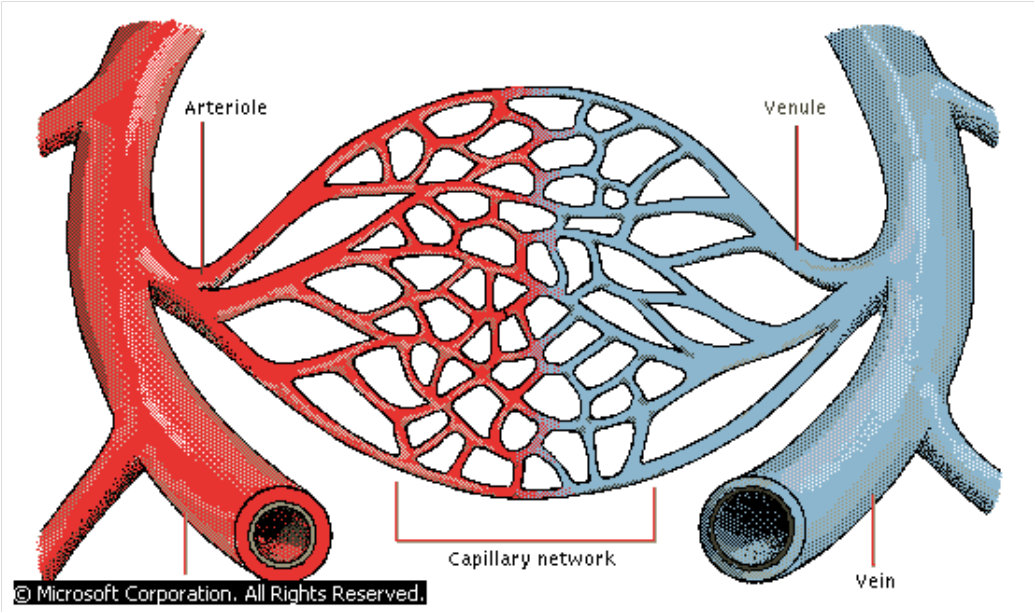
• Capillaries: micro-vessels where exchange of gases, nutrients, & metabolites occurs between plasma & body cells
• Veins: conduits that return deoxygenated blood to the heart
•reservoir: accommodates 70% of circulating blood volume
•Blood: liquid medium in which the respiratory gases, nutrients, metabolic wastes, & hormones are dissolved, and the formed elements of blood (RBCs, WBCs, & platelets) are carried
• Four-chambered muscle: only function is to propel blood forward.
• Predominately muscular
• Dense fibrous tissue forms "skeleton"
• atria, ventricles, valves, & roots of great vessels are firmly attached to this "skeleton"
• Normal size: 2gm/kg of ideal body weight
View this 3D video tour of the heart and blood flow.
Click on the hyperlink to see the cardiac cycle in motion and what is happening at each phase. This web site has tutorials and much information about the cardiac cycle.
• Amount of blood pumped with each heart beat
• Normal volume is 50ml to 100ml
• Determinants of stroke volume are preload (filling volume), afterload (vascular resistance), and contractility (strength/force of contraction)
• Cardiac output can be directly measured at the bedside with a pulmonary artery catheter (PA catheter) or an external non-invasive device.
• Amount of blood ejected by the heart measured in liters/minute
• Cardiac output is the stroke volume multiplied by the heart rate.
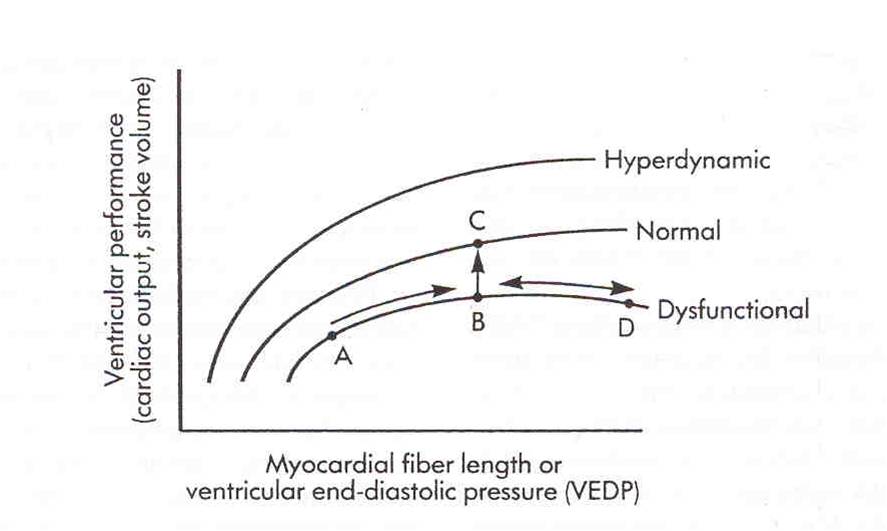
• According to Starling's Law, the greater the end diastolic filling volume, the greater the force of the subsequent contraction of the heart and stroke volume. The stretch of the ventricle causes the increased force of contraction, somewhat like the stretch of a rubber band. The heart rate affects cardiac output. A physiologic response to low cardiac output is tachycardia. It is a compensatory mechanism. Since stroke volume multiplied by the heart rate equals cardiac output, the heart rate will increase to increase cardiac output.
• Pathological tachycardia (i.e. atrial fibrillation, ectopic beats, ventricular tachycardia) will result in decreased cardiac output related to the resulting decreased filling time between contractions. Observe for signs and symptoms of hypoperfusion.
• Pathological bradycardia (i.e. heart block, junctional & ventricular rhythms) may cause decreased cardiac output. This is usually related to the slower heart rate. Sometimes this related loss of the "atrial kick" with certain rhythms. Athletic individuals without pathology and slow heart rates will have normal cardiac outputs.
• Normal CO = 4 to 8 liters/min (relative to body mass index)
• Increase in the end-diastolic myocardial fiber length increases the tension of the myocardial fiber
• If ventricular end-diastolic pressure is increased using fluids, stroke volume and cardiac are increased
• Dysfunctional myocardium will require more volume to increase cardiac output that normal myocardium
• Excessive volume can produce decreased cardiac output and then diuretic or vasodilator may be indicated
• Hyperdynamic myocardium will produce a high cardiac output even in a low volume state
• Ventricular compliance affects cardiac output in response to fluids
• Non-compliant or "stiff" ventricle will respond to small increases in fluids
• Extremely compliant ventricles can tolerate large volumes of fluids, and fluid challenges may produce minimal change in output
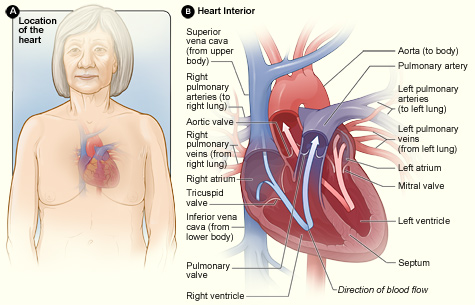
Blood enters the heart from the superior and inferior vena cava into the right atrium, into the right ventricle, into the pulmonary artery, then into the lungs, and back to the heart via the pulmonary vein, into the left atrium, into the left ventricle, through the aorta and out to the body. Preload is the blood that enters the heart either from the vena cava (the body) or the pulmonary vein (lungs).
Preload of the right side of the heart is measured using a central venous catheter to measure central venous pressure (CVP).
• measures volume from the venous system (superior & inferior vena cava entering the right atrium (normal is 0-8)
Preload of the left side of the heart is measured with the use of a pulmonary artery catheter using the wedge pressure measurement (PAWP) or pulmonary artery end-diastolic pressure (PAEDP).
We will be focusing on the use of the CVP measure as preload for the purpose of this discussion.
If the measured CVP is low, the patient may have a low intravascular volume or may have vasodilation from shock or drug therapy. Giving increased IV fluids or blood products may be considered. These treatments should be carefully considered before administration because of potential fluid overload issues. Treatment with IV fluids (crystalloid or colloid) should be based on the patient's symptoms. By increasing the preload the result would indicate increased myocardial performance (increased volume, hence increased stretch).
If the CVP is elevated, this patient may be experiencing fluid overload or heart failure. An increased CVP is also present with cardiac tamponade, pulmonary hypertension, or chronic left ventricular failure. Another correlating symptom may be increased jugular venous distention. Assess vital signs, urine output, and breath sounds. Diuretic therapy may be indicated.
Afterload is the measure of resistance (or impedance) met when the blood enters the vascular bed. Afterload is a calculation that is made when using a pulmonary artery catheter. Since institutions are moving away from invasive monitoring, it is important to recognize and understand signs and symptoms affecting SVR, even without the direct measurement. We will be focusing on the SVR measure as afterload in this discussion.
• Vascular resistance: measurement of resistance (impedance) met from blood entering the arterial bed
• from the left side of the heart (aorta): systemic vascular resistance (SVR)
• from the right side of the heart (pulmonary artery): pulmonary vascular resistance (PVR)
• Increased VR increases myocardial workload and myocardial oxygen consumption
There is an inverse relationship between cardiac output and SVR, which is often compensatory. If cardiac output is low, such as in hemorrhage, SVR will be elevated (vasoconstriction). If cardiac output is high, as in septic shock, SVR will be low (vasodilation).
In an anemic state, the patient may have compensatory tachycardia because of bleeding or decreased oxygen carrying capacity, and elevated SVR.
When aortic regurgitation is present, the back flow of blood causes an increased cardiac output and lower SVR
In fever and septic shock states, the patient has a very dilated vascular bed. This state would cause an increased cardiac output because there is low resistance to flow. In the case of septic shock the patient is "hyperdynamic" and cardiac output will be abnormally high, and SVR will be abnormally low to extremes.
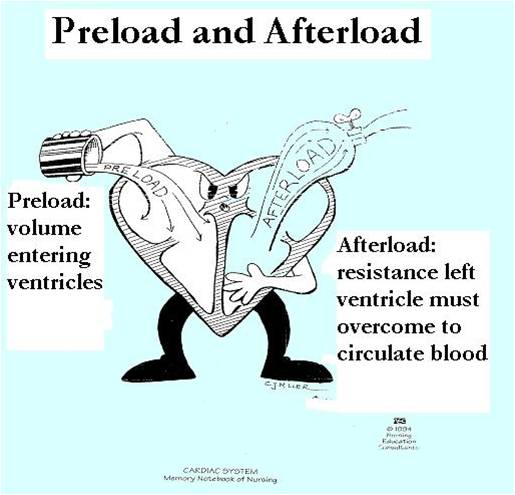
This diagram represents the relationship of preload and afterload. The character here is pouring fluid into the right side of the heart (preload). The left ventricle is ejecting blood into the aorta. The presence of the "spigot" demonstrates that afterload can be high, opening is narrow or nearly closed, making it difficult for fluid to be released; or it is wide open and fluid can pour in freely.
• Force of ventricular ejection
• Refers to pressure generated by ventricles and amount of blood ejected
• Influenced by changes in preload, afterload, and ventricular performance
Contractility cannot be directly measured, even with invasive lines.

Each hemoglobin molecule can carry 4 oxygen molecules. Normal value of SvO2 is 60% to 80%. If a subclavian catheter is used for this measure it is called ScvO2 and those normal values are 65% to 85%. For example, theorize that a normal person's blood was 100% saturated with oxygen at the start of its journey to the tissues after ejection from the heart. When the blood returns to the heart and we measure SvO2, our result is 75%. This means that the blood is still 75% saturated with oxygen and only 25% of the oxygen was utilized or needed while on the journey (or ¾ of the oxygen was utilized). Remember this is a normal person without any pathology. A good point to remember here is that venous blood is still saturated with oxygen. If someone had a sudden cardiac event that caused them to arrest, chest compressions are essential to get that oxygen to vital tissues. If a person is ill, we can expect variation in the SvO2 results.
• Oxygen demands are determined by the metabolic needs of the tissues
• Oxygen is extracted from the hemoglobin and used by the tissues.
• Normal SvO2 is 60% to 80%
• Normal ScvO2 is 65% to 85%
• Values vary slightly because of positioning of the different devices
SvO2 is oxygen saturation measured from a blood sample drawn from distal port of pulmonary artery catheter.
ScvO2 is oxygen saturation measured from a blood sample drawn from a central line placed in the subclavian or jugular vein.
Measures the end result of oxygen delivery and consumption at the tissue level.
• If at rest, SvO2 is measured at 75%, only 25% was extracted by the tissues. The remainder of O2 in the blood was returned to the heart unused by the tissues
• If at rest, SvO2 is measured at 95%. This indicates that the tissues are unable to extract oxygen from the blood and is a very grave sign
Since SvO2 is not routinely measured, one can make some assumptions about SvO2 by remembering the four variables.
1.Cardiac output: an effective pump is how oxygenated blood is delivered to the tissues. If cardiac output is decreased, oxygen delivery will be decreased. Cardiac output should be optimized using medications or fluids as indicated.
2.Oxygenation: the lungs supply the oxygen for the blood. If there are issues such as atelectasis, pneumonia, COPD, pulmonary embolism or other lung conditions, oxygen may not be present for the hemoglobin to carry. Vigorous pulmonary hygiene is essential after all surgery with coughing and deep breathing, incentive spirometers, and activity out of bed.
3. Hemoglobin: carries the oxygen. If the patient is bleeding or anemic, oxygen carrying capacity is reduced. The patient may need blood transfusion.
4. Oxygen consumption (workload): if the workload or demands increase, oxygenation will decrease. Fever, shivering, agitation, and pain are conditions that increase workload.
• Assess & optimize cardiac output
• Assess & correct hypoxemia
• Assess & correct anemia
• Assess & optimize activity and procedure tolerance. Keep patient warm.
• A blood draw and special devices are not needed to determine the status of your patients if invasive lines are not present
• Observe and assess:
• Cardiac output: think perfusion (urine output, skin color & temp, distal pulses)
• Oxygenation (SaO2)
• Hemoglobin/hematocrit
• Affects of activity. Shivering. Fever.
The use of invasive monitoring equipment to augment and verify hemodynamic assessments.
• Monitors must be considered an adjunct to patient evaluation and should never replace frequent bedside physical assessment.
• Use of PA catheter and arterial line allows measurement of cardiac output and vascular pressures and blood flow for assessment of afterload and contractility
• Provides information not available through physical assessment
• Provides measurement of SvO2 of global oxygenation
• Directly measured
• CVP
• PA Pressure
• PAWP
• Cardiac Output
• SvO2
• Calculated from directly measured data
• stroke volume/index
• cardiac index
• SVR/PVR
• O2 delivery
• SvO2: 60% to 75%
• Stroke Volume: 50ml to 100ml
• Stroke Index: 25ml to 45ml/beat/m²
• Cardiac Output: 4 to 8 L/min
• Cardiac Index: 2.5 to 4.0 L/min/m²
• CVP: 2 to 6 mm Hg
• PAP: 15-25/8-15mm Hg
• PAWP: 8 to 12 mm Hg
• SVR: 900 to 1300 dynes sec/cm5
|
Variable |
Assesses |
|
stroke volume/index
|
pump performance
|
|
cardiac output index
|
blood flow
|
|
CVP/RA
|
filling pressure
|
|
PAWP
|
filling pressure
|
|
SvO2
|
tissue oxygenation
|
The use of CRITICAL THINKING skills during assessment to determine hemodynamic status.
First glance, size up the patient... What does inadequate cardiac output look like?
• Think perfusion
In a crisis, physical assessment is brief & focuses on parameters that are key to perfusion: heart rate & rhythm, presence & quality of pulses, capillary refill, color of skin & mucous membranes,
and urine output.
Skin is the first thing one sees while observing a patient. Pallor indicates a decreased perfusion state. The skin becomes pale when blood is shunted to organs. Cyanosis indicates hypoxia; The skin may be cool or warm. Coolness may be an indicator of hypoperfusion. Moisture may occur from perspiration as a result of fever, vasodilation, or work. Edema may be present. This may be from excess IV fluids given to the patient.
One should be thinking about the effects on perfusion (and hemodynamics) when vital signs are abnormal.
• Temperature: hypothermia, hyperthermia
When observing heart rate, keep in mind the normal range of 60-100 beats per minute. When the heart rate is above 100 it may be an indicator of compensation for a low cardiac output.
• Pulse: perfusion, quality, correlation with ECG, SaO2
• Respirations: depth, rate, symmetry, character
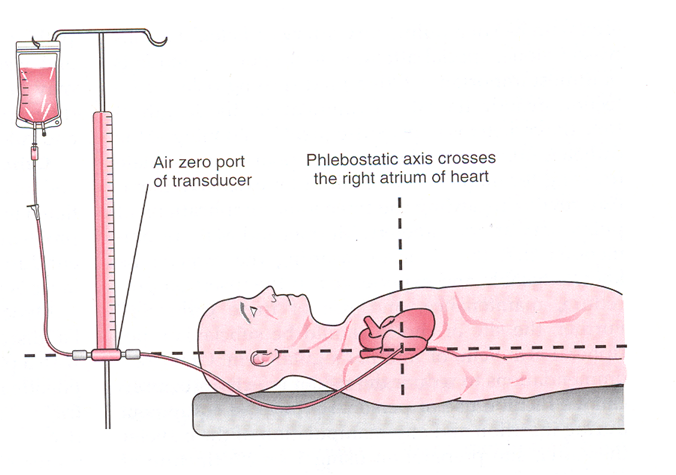
Correlate the arterial blood pressure to the cuff pressure and note the difference, if present. It is not necessary to assess both cuff and arterial pressures at all intervals. It may also be annoying to the patient and painful. Automatic blood pressure should be correlated with an auscultated blood pressure for accuracy especially in cases where the patient is having dysrhythmias. Arterial blood pressure is the most accurate blood pressure, measured directly against the arterial wall. The equipment must be functioning properly and placement correct. The transducer should be placed at the level of the phlebostatic axis. Repositioning of the transducer should occur when the patient is repositioned.
• Blood pressure: hypotension, hypertension
Assess waveform quality for crispness, dampening, and dicrotic notch. Baseline strips should be mounted
• ECG, waveforms
This is the position for all transducers: arterial line, CVP line, PA catheters.
The position is the 4th intercostal space at the midaxillary line. Mark the position on the patient.
Zero the transducer according to the method of the institutional monitoring devices. This negates the effect of atmospheric pressure.
1. Turn the stopcock at the transducer to close the line to the patient and open to atmosphere.
2. Press the zero button to reference monitor. It will read "0"
3.Turn the stopcock at the transducer to close the line to atmosphere and open to the patient
4. Check caps to secure and waveform
.
*Bucher, L. & Melander, S. (1999). Critical Care Nursing
Decreased level of consciousness or an alteration in sensorium or orientation may be an indicator of a hypoperfusion or low cardiac output state.
• Sensorium, orientation
• Weakness, fatigue
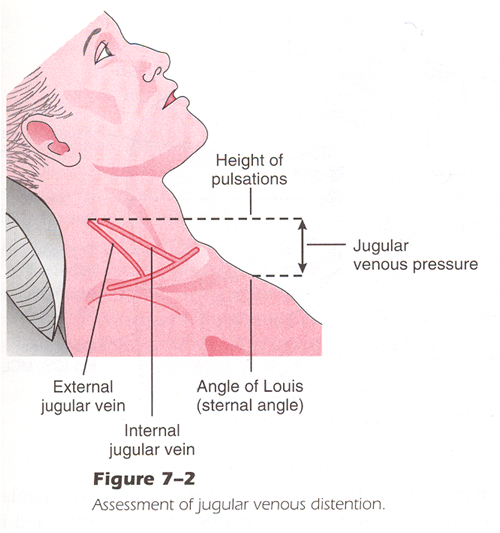
• JVD
JVD is an indicator of fluid status (overloaded or hypovolemic) and would correlate with an elevated CVP.
• Jugular veins normally are fully distended when lying flat in bed
• Normal: absence of JVD with HOB at 30 degrees or higher
• Abnormal to severe: JVD increased with HOB elevated 30 degrees or higher
These are the landmarks for assessing JVD: the identification of internal and external jugular veins, the angle of Louis, and the elevation of the venous distention.
Bucher, L. & Melander, S. (1999). Critical Care Nursing
When a patient is in pain, the stress response is activated. This increases the heart rate, the blood pressure, SVR and as a result, the workload is increased As a result increased myocardial oxygen consumption occurs. This causes an imbalance between oxygen supply and demand which may cause hypoxemia and possibly ischemia. Give analgesics as indicated.
Poorly controlled pain may result in a sympathetic response that can affect the cardiovascular system. This may result in increased heart rate, cardiac output, blood pressure, SVR, increased cardiac workload and myocardial oxygen consumption. The diastolic filling time decreases with an elevated heart rate resulting in an imbalance between myocardial oxygen demand and supply causing hypoxemia or ischemia (Watt-Watson & Stevens, 1998).
• Assessment
• Hemodynamic effects
• Effects of pain interventions
Encourage your patients to be active in pulmonary hygiene to prevent complications. Also, encourage ambulation as early as possible.
• Breathing patterns
• Breath sounds
• Cough
• sputum
• hemoptysis
• Dyspnea
• Tachypnea
• Abnormally slow respirations for condition
• Neurologic deterioration
• restlessness, agitation
• lethargy
• confusion
• Symptoms
• Chest pain: angina, pericarditis
• Heart Sounds
• rate
• rhythm
• quality
Cardiac tamponade is caused by fluid or blood collecting in the pericardium resulting in compression of the heart. This inhibits the heart from filling adequately and ejecting a normal cardiac output. Assessment of heart tones hourly allows the nurse to determine if tamponade may be occurring. Heart tones will diminish with tamponade. Pulse pressure decreases because of the compression of the heart. Systolic pressure is lower because of the lower cardiac output, diastolic pressure is higher because of the compression. Increased CVP is a result of the inability of the right atrium to empty into the ventricle. Tachycardia is compensatory for low cardiac output.
• May be acute or gradual
• Diminished heart sounds
• Narrowed pulse pressure (SBP-DBP)
• Increased CVP
• Tachycardia
• Signs & symptoms of decreased cardiac output
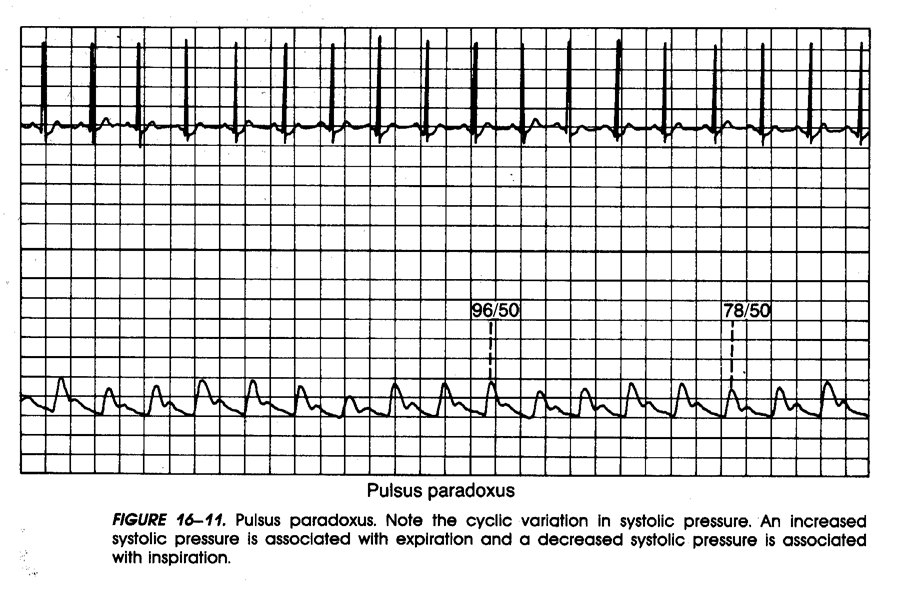
• Pulsus paradoxus: Caused by a decrease in pulse volume during inspiration and increase during expiration
Pulsus paradoxus is caused by the increased pressure in the thoracic cavity during inspiration, when cardiac tamponade is present. This can be seen on the arterial pressure waveform. Note the respiratory artifact and variation in blood pressure. Also, note the low pressures related to the decreased cardiac output.
• Intermittent sounds correlate with expiration
• Slowly deflate cuff until all sounds auscultated thru breathing cycle
• Pressure difference between phasic and consistent sounds is the measure
• Variability of 5-10mm Hg is significant
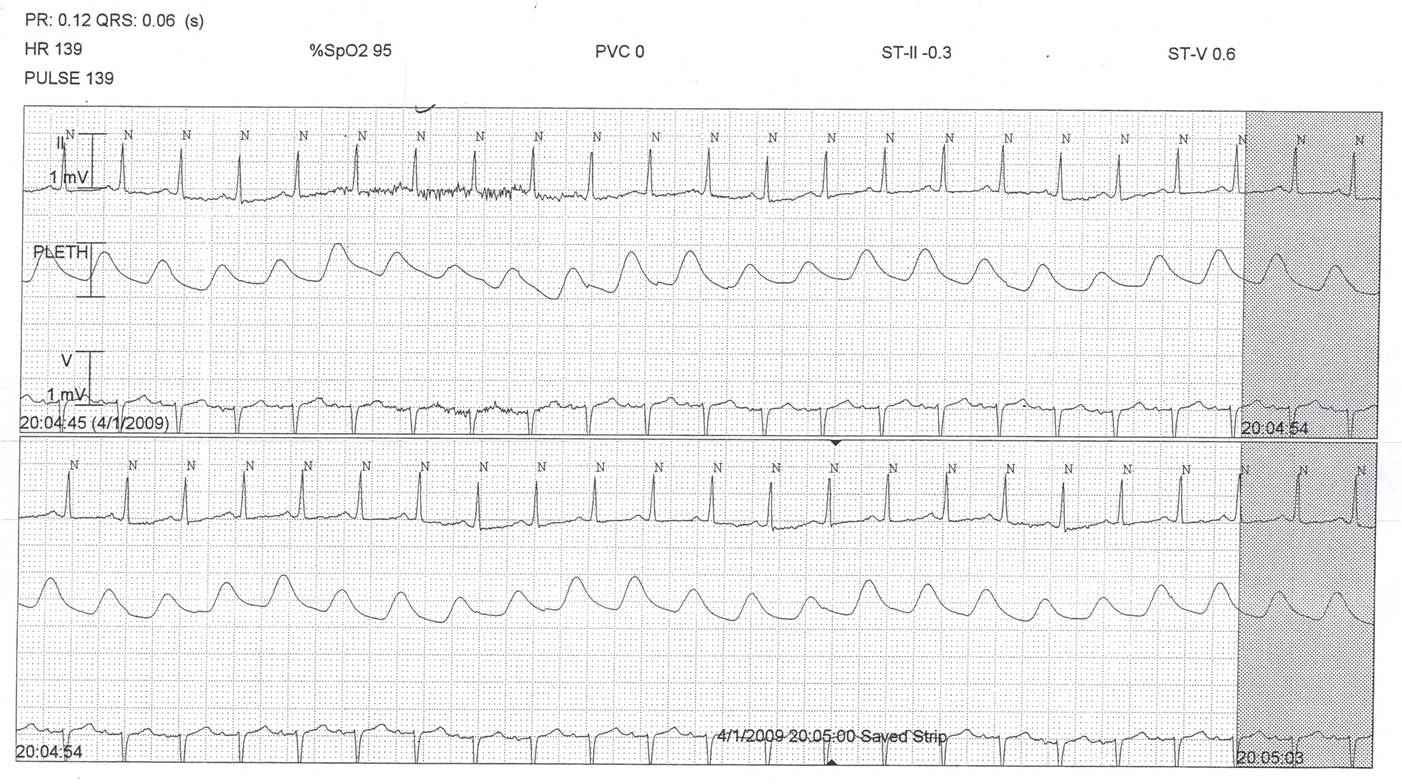
• May also be visible on SaO2 waveform
This is an emergency situation and the physician must be notified immediately! Elevating the head of the bed helps to empty the atria empty into the ventricles to improve cardiac output. Fluids will increase preload to help improve cardiac output. If the condition is bleeding from a surgical procedure, the patient may need to go back to surgery. If the condition occurs over a period of time, a pericardiocentesis or pericardial window may be performed.
• Elevate HOB to 20 degrees
• Rapidly infuse fluids
• increase preload
• notify physician
• pericardiocentesis
• back to OR if cardiac surgery
Consider the effects of the rhythm on the cardiac output. If the patient is tachycardic, determine causation and treat as indicated based on signs and symptoms and assessment.
• Effects on cardiac output
• rhythm
• rate
• ectopy
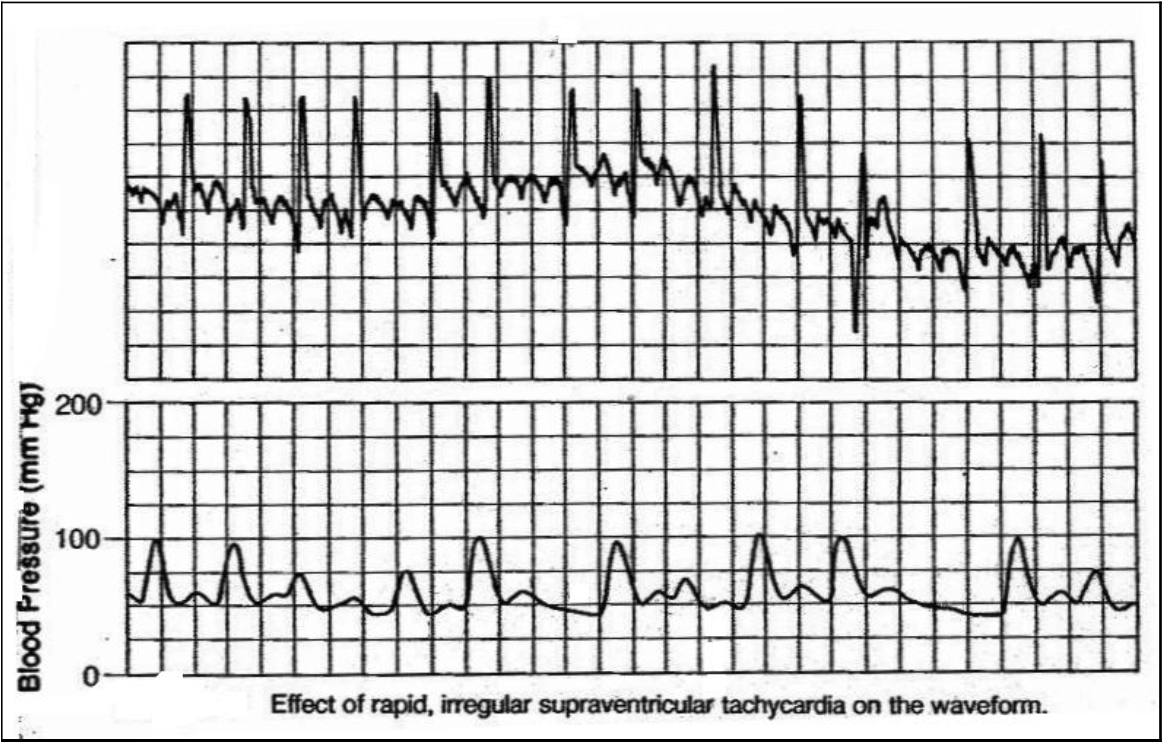
Note in this arterial waveform the patient has atrial fibrillation with a rapid ventricular response. The filling time is variable because of the rhythm and rate, therefore decreased cardiac output can be visualized from the arterial pressure waveform.
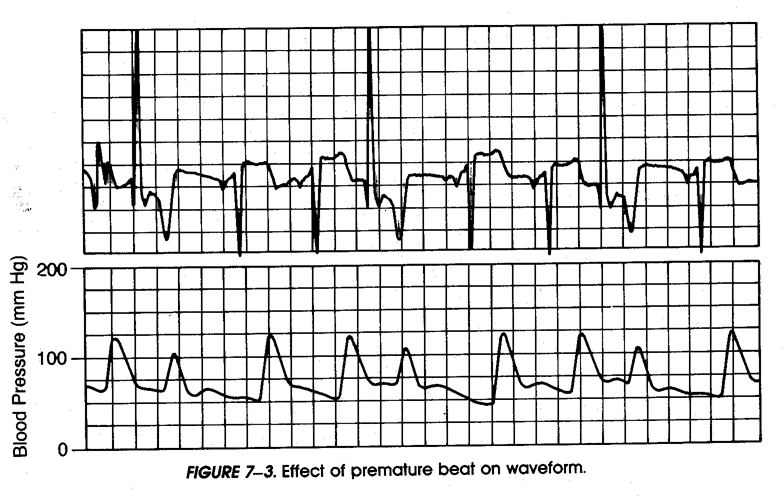
The same holds true when early ectopic beats occur resulting in decreased cardiac output. This beat may not perfuse.
A patient may develop a distended abdomen as a result of decreased GI motility postoperatively. A distended abdomen can cause a patient to be unable to take deep breaths. Vomiting may have profound effects on hemodynamics as well as pain in the surgical patient.
• Distention
• Bowel Sounds
• Nausea & Vomiting
Urine output is an excellent indicator of cardiac output and perfusion. Periods of hypotension can cause a patient to develop acute renal failure. Urine output as well as serum creatinine must be monitored postoperatively. This should be correlated with fluid balance and daily weights.
• Urine output & appearance
• how much is enough?
• 0.5ml/kg/hr
• Foley patency
• Daily weights
Pulse quality indicates perfusion/adequate cardiac output. The distal circulation must be checked hourly in the extremity with an arterial line.
• Temp
• Capillary refill
• Pulse quality
• Color of extremities
Hemoglobin and Hematocrit are indicators of bleeding, but also oxygenation. Abnormal blood gases should be corrected. Alterations in homeostasis can lead to decreased cardiac output as well as dysrhythmias. Cardiac surgery patients are sensitive to disturbances in electrolytes. These should be monitored and corrected. Electrolyte imbalances can lead to cardiac dysrhythmias.
Use caution with administration on NSAID's. Monitor renal function tests and urine output.
• Hgb & Hct
• Electrolytes
• Arterial blood gases
• respiratory acidosis/alkalosis
• metabolic acidosis/alkalosis
|
Atropine Pacemaker
|
<- low
|
Heart Rate
|
high -> |
Beta Blockers Calcium Blockers
|
|
Fluids
|
<- low
|
Preload
|
high ->
|
Diuretics Venodilators
|
|
Vasopressors
|
<- low
|
Afterload
|
high ->
|
Arterial Dilators Calcium Blockers ACE Inhibitors
|
|
Inotropic Agents
|
<- low
|
Contractility
|
|
|
• Decreased CVP • Hemorrhage
• Decreased PAWP • Third spacing
• Decreased SV/SI • Diuretics
• Decreased CO/CI • Dehydration
• Decreased SvO2
• Increase ventricular end-diastolic blood volume (preload)
• Expected response from treatment
• decreased heart rate
• increased SV/SI
• increased CO/CI
• increased SvO2
• Crystalloids
• normal saline
• lactated ringers
• Colloids
• albumin
• hetastarch
• blood & blood products
• Increased CVP/PAWP • Ventricular failure (AMI)
• Variable SV/SI • Renal failure
• Variable CO/CI • Fluid overload
• Variable SvO2
• Pulmonary congestion
• Relieve pulmonary congestion
• Expected response
• Decreased CVP/PAWP
• Increase SV/SI
• Increase CO/CI
• Relieve pulmonary congestion
• Increased SvO2
• Diuretics
• furosemide (Lasix)
• bumetanide (Bumex)
• Venodilators
• nitroglycerin
• Caution: excess preload reduction may result in decreased SV/SI, CO/CI, & SVO2
• When given IV, dose may be extremely variable (10mg to 200mg)
• Frequency based on patient response
• May be given as continuous infusion
• Monitor electrolytes
• Venodilator
• Wide range of dosing (5mcg/min to 400mcg/min)
• Titrate IV from lowest dose
• Rapid onset of action
• Short half-life
• Improves coronary blood flow
• Normal or decreased CVP/PAWP
• Increased CO/CI
• Decreased SVR
• Decreased BP
• Sepsis/septic shock
• Severe anemia
• Spinal shock
• Anaphylactic shock
• End-stage cirrhosis
• Improved tissue perfusion
• Expected Response
• increased SVR
• increased CVP/PAWP
• increased BP
• Vasopressors
• dopamine
• epinephrine
• norepinephrine
• phenylephrine
• Caution: many patients with decreased afterload may also have hypovolemia & preload may need to be increased also.
• Alpha Receptors
• stimulation of alpha I receptors produces vasoconstriction
• Beta receptors
• stimulation of beta I receptors increases the inotropic and chrontotropic state of the heart
• stimulation of beta II receptors produces vascular smooth muscle relaxation
• Always infuse through a central line
• Extravasation of drug into tissues may cause severe tissue inflammation and/or necrosis
• Start at lowest dose, titrate to effect
• Wait 5-10 minutes between dose adjustments
• Be patient, time stands still
• Strong alpha & beta stimulant, effect varies with dose
• Stimulates dopaminergic receptors
• Vasopressor effect is mild at low doses and increases as dose is increased
• Dose up to 20 mcg/kg/min for vasopressor effect
• Titrate to effect
• Strong alpha stimulant, milder beta stimulant
• Dose: start at 1 mcg/min
• Titrate to effect
• Strong alpha stimulant
• Mild beta stimulant
• Dose: 1 mcg/min to 20 mcg/min
• Titrate to effect
• Stronger alpha stimulant than beta
• Dose: start at 15mcg/min
• Titrate to effect
• Vasopressors work by stimulating alpha receptors (sympathetic nervous system)
• Normal vasopressor response is a rapid rise in BP
• Failure of vasopressor to raise BP is an indication of severity of condition
• Consider effects of drugs particularly when doses are maximized
• Increased SVR • Hypertension
• Increased CVP/PAWP • Increased sympathetic stimulation
• Decreased CO/CI
• Decreased SvO2
• Variable BP
• Improve ventricular performance
• Expected Response
• decreased SVR
• decreased BP
• decreased CVP/PAWP
• increased CO/CI
• increased SvO2
• Vasodilators
• nitroprusside
• hydralazine
• ACE inhibitors
• enalapril
• captopril
• Calcium channel blockers
• diltiazem
• Beta Blockers
• Metoprolol
• Breviboc (esmolol)
• labetolol
CAUTION! Excessive afterload reduction may result in hypotension and decreased tissue perfusion.
• Powerful arterial dilator
• Mild venodilator
• Dose 0.5 mcg to 10 mcg/kg/min
• Byproduct of breakdown is cyanide
• short term use
• observe symptoms of toxicity
• thiocyanate levels
• Rapid onset of action
• Captopril
• (Capoten)
• 25-450 mg/day PO
• (bid or tid)
• Enalapril
• (Vasotec)
• 5-40 mg/day PO
• (once daily or bid)
• Enalaprilat
• (Vasotec IV)
• 1.25-5.0 mg IV Q 6 hr
• Given over 5 minutes
• Lisinopril
• (Prinivil, Zestril)
• 5-20 mg/day PO
• (once daily)
• Inhibit contraction of smooth vascular muscle
• Reduce myocardial workload through vasodilatation
• Negative contractility effect
• May cause bradycardia and heart block
• Initial dose 0.25mg/kg IV bolus
• Second bolus of 0.35mg/kg IV over 2 minutes may be given if desired response not obtained
• Continuous infusion of 5mg to 10 mg/hr
• Non-selective blockers-produce decrease in BP without reflex tachycardia or reduction in heart rate, through a mixture of β-blocking effects.
• Selective blockers competitively block stimulation of β1 receptors in cardiac smooth muscle; produce chronotopic and inotropic effects
• Uses-hypertension, ventricular dysrhythmias, prophylaxis for angina
• Common side effects: orthostatic hypotension, bradycardia, diarrhea, nausea, vomiting
• Decreased CO/CI
• Decreased SV/SI
• Increased SVR
• Variable BP
• Decreased SvO2
• Ventricular Dysfunction
• myocardial ischemia/infarction
• cardiomyopathy
• myocardial depression (sepsis)
• Improve ventricular performance
• Expected Response
• increased CO/CI
• increased SV/SI
• decreased CVP/PAWP
• decreased SVR
• improved tissue perfusion
• Inotropic Agents
• dopamine
• dobutamine
• aminrone
• milrinone
• digoxin
• Stimulate beta receptors to increase inotropic state of the heart
• Beta receptor stimulant
• Dose 1 to 20 mcg/kg/min
• Titrate to effect (increase CO/CI, SV/SI, SvO2)
• May lower BP & SVR
• Side effects
• tachycardia
• increased myocardial workload
• hypotension
• Stimulates both alpha & beta receptors
• Hemodynamic effect dose dependent
• Low-dose 1mcg to 5mcg/kg/min: improves renal & mesenteric blood flow
• Mid-dose 5mcg to 10mcg/kg/min: improves contractility
• High-dose: 10mcg to 20mcg/kg/min: increases SVR and BP
• Act by increasing intra-cellular calcium
• Inhibiting degradation of cyclic AMP
• May be useful if sympathetic stimulation (alpha & beta) is not effective
• Milrinone (Primocor)
• loading dose 0.05 mg/kg over 10 minutes
• continuous infusion 0.0375 to 0.75mcg/kg/min
• Titrate to improve SV/SI, CO/CI, & SvO2
• May lower SVR & BP
• Side effects: hypotension, thrombocytopenia
A 68 year old female patient is admitted to the post-operative unit following a colon resection. She has a history of MI 6 months ago.
Vital Signs:
BP = 88/68
HR = 112
Urine Output = 15 ml/ hr
This patient has low cardiac output as evidenced by low blood pressure, tachycardia, low CVP, and low urine output. Fluid resuscitation is an appropriate intervention for this patient. Review the labs and determine if bleeding may have been an issue. Assess the body temperature. If the patient is cold, she may be experiencing a high SVR and low cardiac output. Warming the patient will increase vasodilation which will lower SVR and increase the cardiac output.
• Low cardiac output
• BP low
• Compensatory tachycardia
• Low urine output
• Give crystalloids or colloids
• Check Hgb & Hct
• Continue monitoring VS and give fluids/blood accordingly
• Consider other options to improve CO
• What is the patient's temp? How would this affect the patient's hemodynamics?
• Keep patient warm!
Mr. Green is admitted to the medical unit this morning from the E.D. with probable urosepsis. On admission his blood pressure is 144/74, HR 88, temperature 99.6. Blood cultures and lactate (normal result) were drawn in the E.D. and IV antibiotics were started. WBC is 18,000. Urine is positive for WBCs and blood.
Several Hours Later….
It is now 4am and the CPA reports some changes in the VS to the nurse: BP 88/54, HR 122, resp 28, temp 100.6. The nurse reviews the VS from the previous hours and notes some trending
8pm: BP 124/72, HR 98, resp 18
12MN: BP 100/64, HR 110, resp 24
• Significant changes in VS
• Signs and symptoms of severe sepsis have developed
• Presumed increased cardiac output and decreased SVR (compensation for dilated vascular bed)
Actions:
• Notify physician: prepare to administer IV fluid boluses
• Rapid Response Team
• Transfer to higher level of care: anticipate immediate supportive care needs (vasopressors)
A 65 year old male patient underwent radical retropubic prostatectomy for cancer. He has a history of MI 8 months ago with an EF of 25%. He is in the CCU postoperatively for closer monitoring.
Vital Signs/Assessment:
BP = 90/58
HR = 110
CVP = 8
Urine Output = 10 ml/hr
• Low cardiac output
• Tachycardia (compensatory for low CO)
• Urine output low
• Low blood pressure
• May need vasopressor agent
• CVP
• Fluid status adequate
• cautionary use of fluid: small volume bolus may be helpful (Starling's law)
82 year old male patient admitted to Cardiac Unit post-emergent 4 vessel CABG. Chest tube output was 300ml in PACU. First hour on unit, chest tube output is another 200ml. Second hour on unit, chest tube output is 30ml.
Vital Signs 1st Hour:
CVP = 7
ABP = 102/56
HR = 88
RR = 14
Urine output = 80ml
Vital Signs 2nd Hour:
CVP = 15
ABP = 92/76
HR = 125
RR = 18
Urine output = 10ml
The patient's BP continues to decline and you have given 500ml 5% albumin. The vital signs are slightly better, but your inner voice says things are not quite right.
BP = 100/78
HR = 120
CVP = 18
Urine Output = 10ml
Chest tube output = 0
• Low BP, narrowed pulse pressure
• Arterial & SaO2 waveform: pulsus paradoxus?
• Increased CVP
• Increased JVD
• Decreased urine output
• Decreased to ZERO chest tube output
Cardiac Tamponade
• Your patient is compromised: act quickly!
• Elevate head of bed
• Notify MD
• Fluids!
• Prepare for procedure:
• back to OR to locate source of bleeding
• pericardial window or pericardiocentesis
A 75 year old male patient is 3 days postop colon resection. Pain issues have been significant & activity really has to be pushed. He does not like to cough and EZ PAP treatments were initiated. He has developed pallor and restlessness. Now he is not maintaining his SaO2 and you are increasing his oxygen. He tells you that "something is wrong and he just can't put his finger on it." Anxiety level is high and his wife says, "He's never like this! What's wrong with him? You better call the doctor!!"
Vital Signs
BP = 144/56
HR = 135
RR = 28
SAO2 = 92% with 12 liter concentrator
Pulmonary Embolism
• Actions & Interventions
• Call MD
• Prepare for CTA
• Anticoagulants
• Bedrest
• O2
• Supportive care, as indicated
• Cardiac Output
• optimize
• Hemoglobin
• Check lab values
• Give blood as needed
• Oxygenation
• SaO2
• ABG
• Postop atelectasis
• pneumonia
• Workload
• Shivering
• Fever
• Activity
Thank you for reviewing the Hemodynamics content. To receive CE credit, please take the post test assessment located on the left sidebar. Once you have sucessfully completed the exam, please complete a course evaluation. Once both have been completed, a certificate will be issued to you within 5-7 business days. See the instructions tab on how to obtain your certificate.
Contact info gail.boston@nmhs.org
AACN (1998). Protocols for Practice: Hemodynamic Monitoring.
Published May 2000 by Bartleby.com; © 2000 Copyright Bartleby.com, Inc. (Terms of Use).
Bucher, L. & Melander, S. (1999). Critical Care Nursing.
Darovic, G. (2002). Hemodynamic Monitoring: Invasive & Noninvasive Clinical Application.
Dobbin, K. (2002). Noninvasive Blood Pressure Monitoring. Critical Care Nurse.
Lynn-McHale, D. & Carlson , K. (2005). AACN Procedure Manual for Critical Care.
McGhee, B. & Bridges E. (2002). Monitoring Arterial Blood Pressure: What You May not Know. Critical Care Nurse.
Mosby's Nursing Drug Reference (2006).
National Heart Lung and Blood Institute, http://www.nhlbi.nih.gov/index.htm
PACEP.ORG
Watt-Watson, J. & Stevens, B. (1998). Managing Pain after Coronary Artery Bypass Surgery. American Journal of Critical Care, 3(1), 25-30.
White, Kathy (2007). Fast Facts for Critical Care.